


Why RSI Can Stay "Overbought" for Weeks in a Strong Trend

Fundamental Analysis
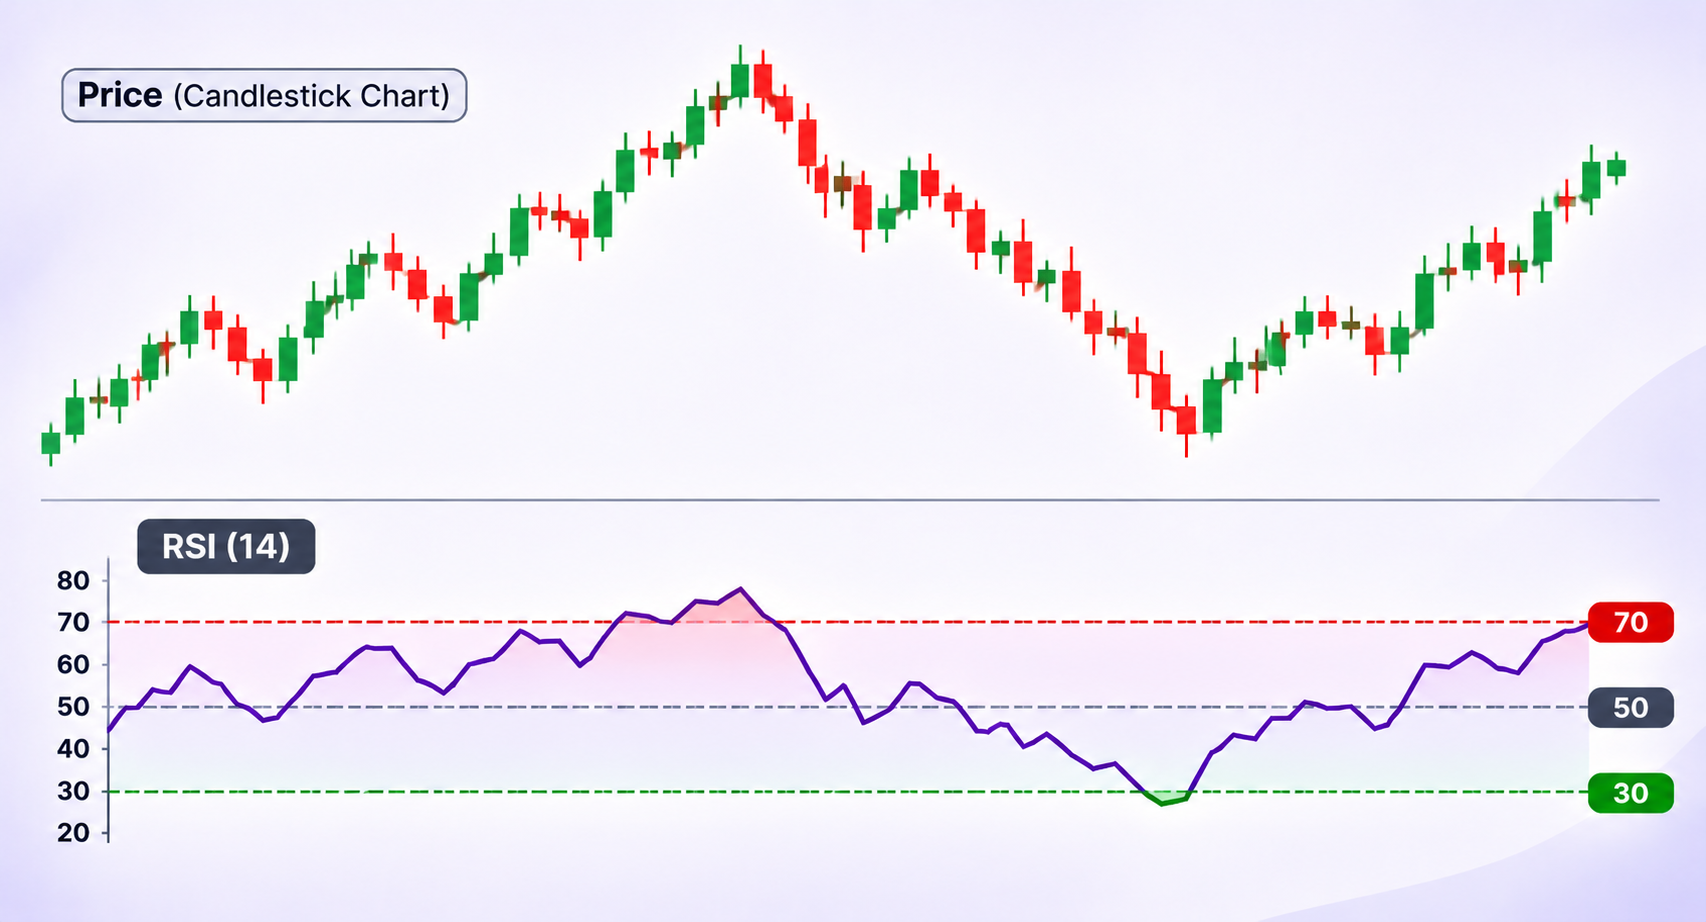
A stock crosses an RSI reading of 70, and many traders start expecting a fall. But what if the stock keeps rising and the RSI remains above 70 for several days or even weeks? This can happen when buying momentum stays strong.
Knowing the reason why the RSI continues to stay overbought when there is a strong trend is an essential factor for avoiding mistaking each occurrence of high values as a signal of reversal.
Quick answer
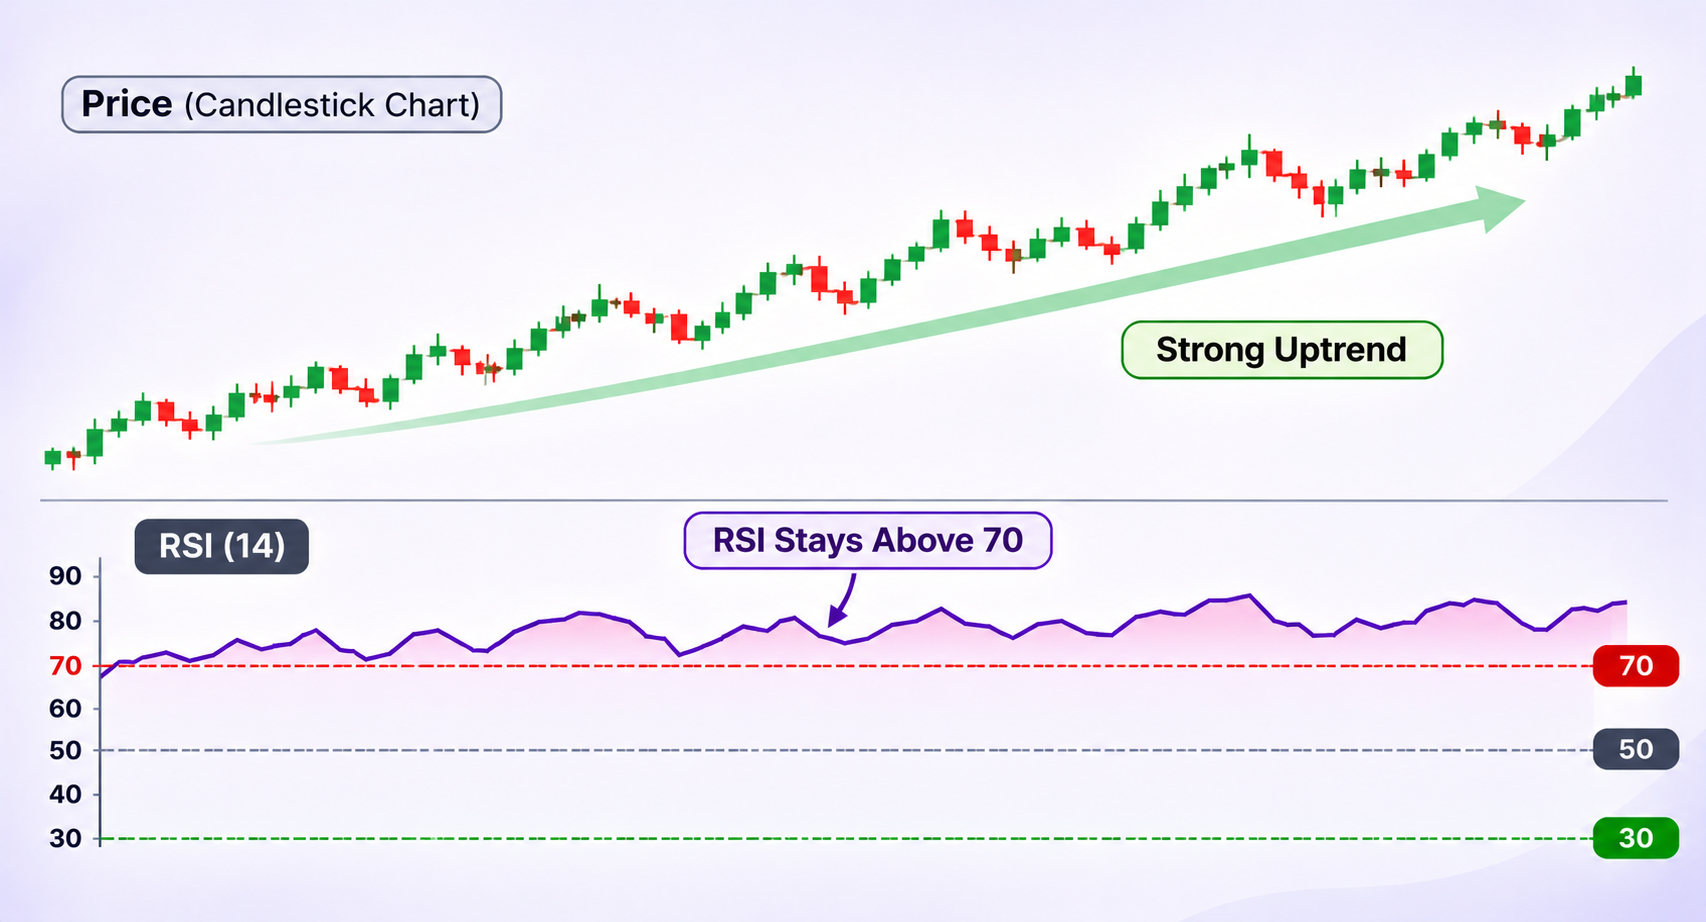
When a stock keeps closing higher and its price falls only slightly between gains, RSI can remain above 70 for weeks. Its recent gains continue to outweigh its losses. This is why traders should not treat every overbought reading as a sign that the stock is ready to fall.
What does an overbought RSI reading mean?
The Relative Strength Index (RSI) is a momentum indicator that ranges from 0 to 100. Usually uses in Technical Analysis. It compares recent gains with recent losses to show how strongly a price has been moving.
| RSI Range | Interpretation | Potential Action/Signal |
|---|---|---|
| 70–100 | Overbought | Potential downward correction or shorting opportunity |
| 60–70 | Strong Bullish Zone | Uptrend is active |
| 40–60 | Neutral Zone | Wait for a clearer breakout or trend confirmation |
| 30–40 | Weak Bearish Zone | Downtrend is active |
| 0–30 | Oversold | Potential upward bounce or buying opportunity |
Many traders use the 14-period RSI, although the setting can vary.
An RSI above 70 means recent upward price movement has been stronger than downward movement. It does not mean the stock must fall or that its price is too high based on its business value.
Why RSI can stay overbought in a strong trend
The main reason is continued buying momentum. When a stock keeps making higher highs and its pullbacks remain limited, recent gains can continue to outweigh recent losses.
Take an example: a stock that goes up on several days but falls slightly on other days. In such circumstances, the RSI can rise to above 70 since the price action is generally going up.
There are 3 common reasons for this behavior.
1. Buying pressure remains strong
Since buyers are consistently entering the market, the stock may continue to rise even after the RSI crosses 70 because small drops in prices will not bring down the indicator.
That is why an overbought market does not always mean a reversal is imminent.
2. Pullbacks are short and shallow
During an uptrend, the price can take a break for some time before continuing its upward movement. Such short retracements provide limited downside pressure to the RSI.
As a result, RSI may remain near or above 70 even when the stock is not rising every single day.
3. The indicator measures recent momentum
RSI uses price changes over a selected period. It does not predict what will happen next. If recent gains remain stronger than recent losses, the reading can stay high.
How RSI behaves in a strong uptrend
The traditional 70 and 30 levels are useful reference points, but RSI behavior can change with the market trend.
In a strong uptrend, RSI may often move within a higher range, such as 40 to 90. The 40-50 area can sometimes act as support for the RSI during pullbacks. This is a tendency, not a fixed rule.
| Market Condition | Common RSI Behaviour |
|---|---|
| Strong uptrend | RSI may stay above 70 for extended periods |
| Strong downtrend | RSI may remain below 30 |
| Sideways market | RSI may move more frequently between 30 and 70 |
What should traders check instead of selling only on RSI 70?
1. Check the price trend.
Look at whether the stock is making higher highs and higher lows. If the overall trend remains upward, one high RSI reading may not be enough to suggest a reversal.
2. Observe RSI near the 50 level.
During an uptrend, RSI may find support around 40-50 during corrections. Watch whether momentum recovers from this area, rather than focusing only on the 70 level.
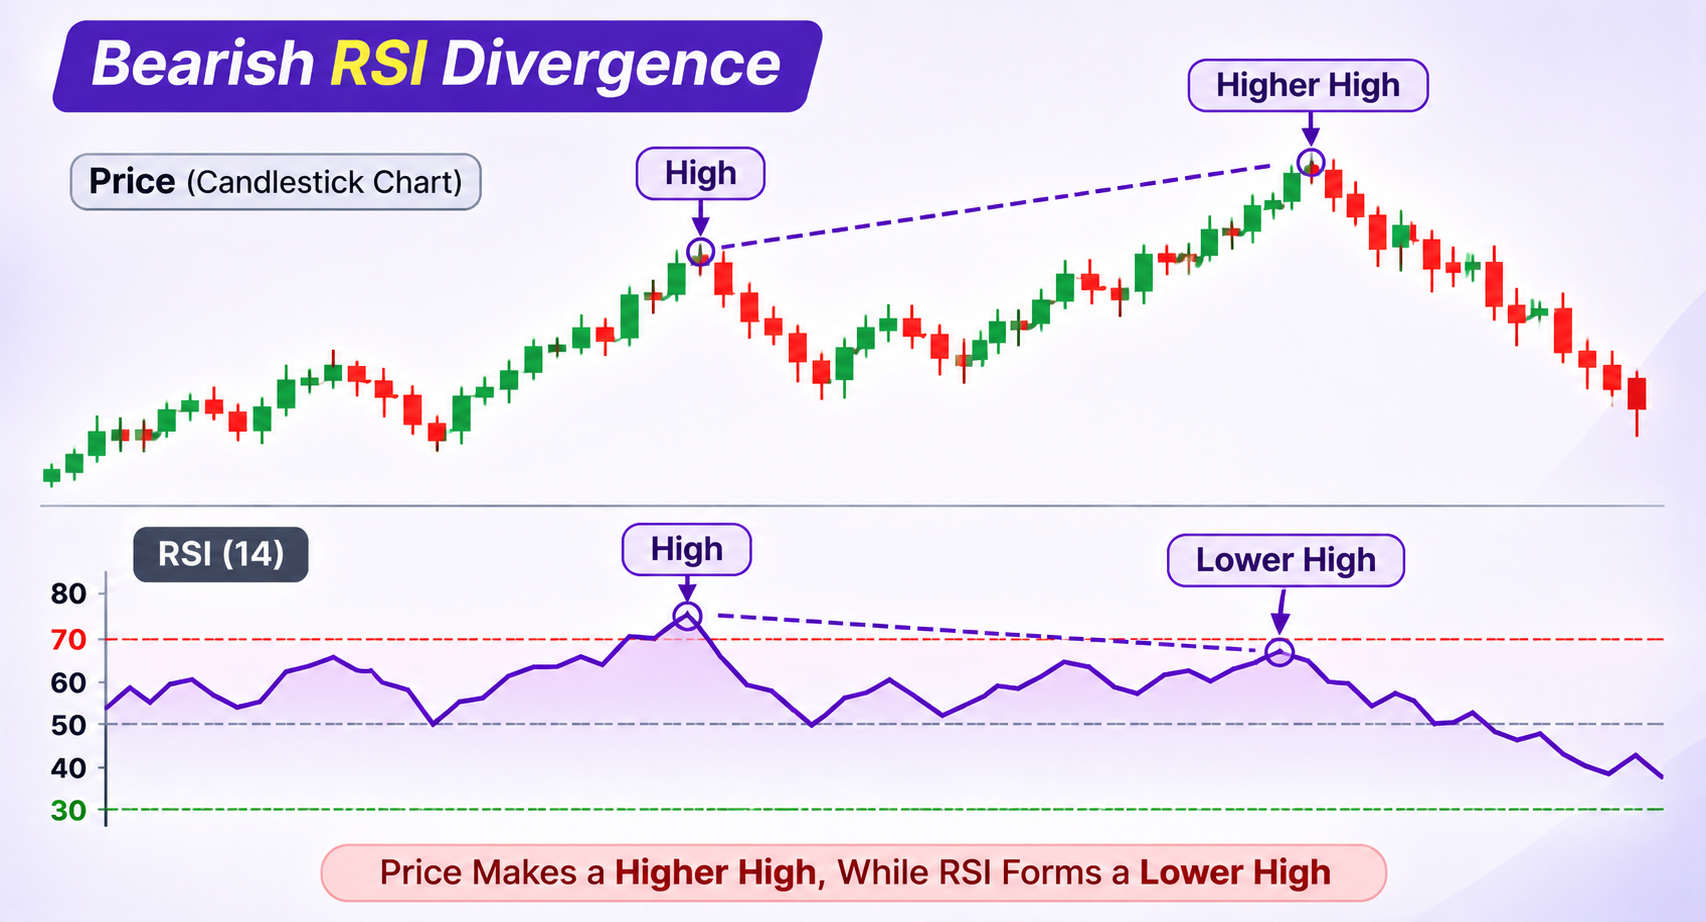
3. Look for bearish divergence.
Bearish divergence occurs when price forms a higher high while RSI makes a lower high. It may be a signal of weakening bullish momentum, yet it is not a confirmation of trend reversal.
4. Study price action and volume
Look for price changes like an inability to form higher highs, heavy selling bars, and unusual volume patterns; these can provide more information than RSI alone.
Conclusion
RSI can stay overbought for weeks when a stock continues to show strong upward momentum. A reading above 70 is a sign of strong recent price movement, not an automatic warning to sell. Traders should study the trend, price action, RSI behaviour, and volume together before drawing conclusions.
Frequently asked questions
Q. Is it possible that the RSI remains above 70 for weeks?
Ans. Yes, in a strong bullish market continuous buying pressure can keep RSI above 70 for several weeks without an immediate price reversal.
Q. Does an overbought RSI mean a stock is overvalued?
Ans. No. RSI measures recent price momentum. It does not measure a company's financial value or tell whether its share price is fundamentally expensive.
Q. Should traders sell when RSI crosses below 70?
Ans. Not automatically. Traders should also check the price trend, support levels and other indications of weakening momentum before interpreting the move.
Q. What RSI level is useful during a strong uptrend?
Ans. Sometimes, a 40-50 range can provide support for RSI during an uptrend. This, however, depends on the stock and the trading environment.
Q. What is bearish divergence in RSI?
Ans. Bearish divergence occurs when the price makes a higher high while RSI makes a lower high. It may indicate weakening momentum, but does not confirm a reversal.
Disclaimer: Investments in the securities market are subject to market risks. Please read all related documents carefully before investing. This article is intended for informational and knowledge purposes only and should not be considered tax, financial, or investment advice. Tax laws and deductions may vary based on individual circumstances and regulatory changes. Readers are advised to consult a qualified tax advisor or financial professional before making any investment or tax planning decisions.
Indira Securities Private Limited (SEBI Reg. No.): NSE TM ID: 12866 | BSE TM ID: 663 | CDSL DPID: 17000 | SEBI Reg. No.: INZ000188930 | MCX TM ID: 56470 | NCDEX TM ID: 01277 | CDSL Reg. No.: IN-DP-90-2015 | CIN:U67120MP1996PTC085111 | RA SEBI Reg. No.: INH000023269 | IA SEBI Reg. No.: INA000021410 | SEBI Merchant Banking Reg. No.: INM000013536
Related Posts
Discover more insights and expert advice on investing and financial planning.


Value Investing vs Growth Investing: Which One Fits Your Goals?


Value Investing Strategy in India: Applying Benjamin Graham's Principles to Indian Stocks

Trend-Following vs Mean-Reversion: Two Opposite Technical Strategies Explained

Open Your Free Demat Account
Getting started doesn’t take much. No paperwork, no hidden charges. Just a few steps and you’re ready to invest or trade.
Open Your Free Demat Account Today
No paperwork | No hidden fees | Just a few taps to get started.