


Trend-Following vs Mean-Reversion: Two Opposite Technical Strategies Explained

Fundamental Analysis
Some traders look for stocks that are already moving in one direction. Others look for prices that have moved too far and may return towards their recent average. These are two different approaches to technical analysis: trend following and mean reversion.
Both use price movements to study market behaviour, but they look for different opportunities. Understanding how they work can help traders recognise when each approach may be more suitable.
Quick Answer
Trend following means studying an existing price direction and looking for signs that it may continue. Mean reversion means looking for prices that have moved away from their recent average and may move back toward it. Trend following focuses on continuation, while mean reversion focuses on a possible return towards the average.
What is a trend following strategy?
A trend following strategy tries to move in the same direction as the existing market trend. If a stock is rising, the approach looks for signs that the upward move may continue. If it is falling, the focus is on the downward trend.
The idea is simple, instead of trying to predict the exact top or bottom traders study the direction already visible on the chart.
For example, a stock moves from Rs 500 to Rs 550, pauses near Rs 540 and then rises above Rs 550. A trend following approach would study whether the breakout has enough support to suggest that the upward move may continue
Common tools used in trend following are:
Moving averages: Help identify the broader price direction.
Trendlines: Identify the direction and pattern of the price movement.
Breakouts: Help identify when price moves beyond an established range.
What is a mean reversion strategy?
A mean reversion strategy is based on the idea that prices may move back towards their recent average after moving unusually far away from it.
For example, imagine a stock usually trades around Rs 500 but falls sharply to Rs 460. A mean reversion approach would study whether the fall is temporary and whether the price may recover towards its recent average.
This approach is often studied when prices move within a range rather than follow a strong trend.
Common tools include:
Relative Strength Index (RSI): Helps identify periods of strong recent buying or selling.
Bollinger Bands: Show how far price has moved from a moving average relative to recent volatility.
Moving averages: Provide a reference point for comparing the current price with its recent average.
Trend following vs mean reversion: Key differences
The main difference is what each strategy expects the price to do next.
| Factor | Trend Following | Mean Reversion |
|---|---|---|
| Main Idea | Existing trend may continue | Price may return towards its average |
| Market Condition | Strong upward or downward trend | Sideways or range-bound market |
| Common Tools | Moving averages, trendlines, breakouts | RSI, Bollinger Bands, moving averages |
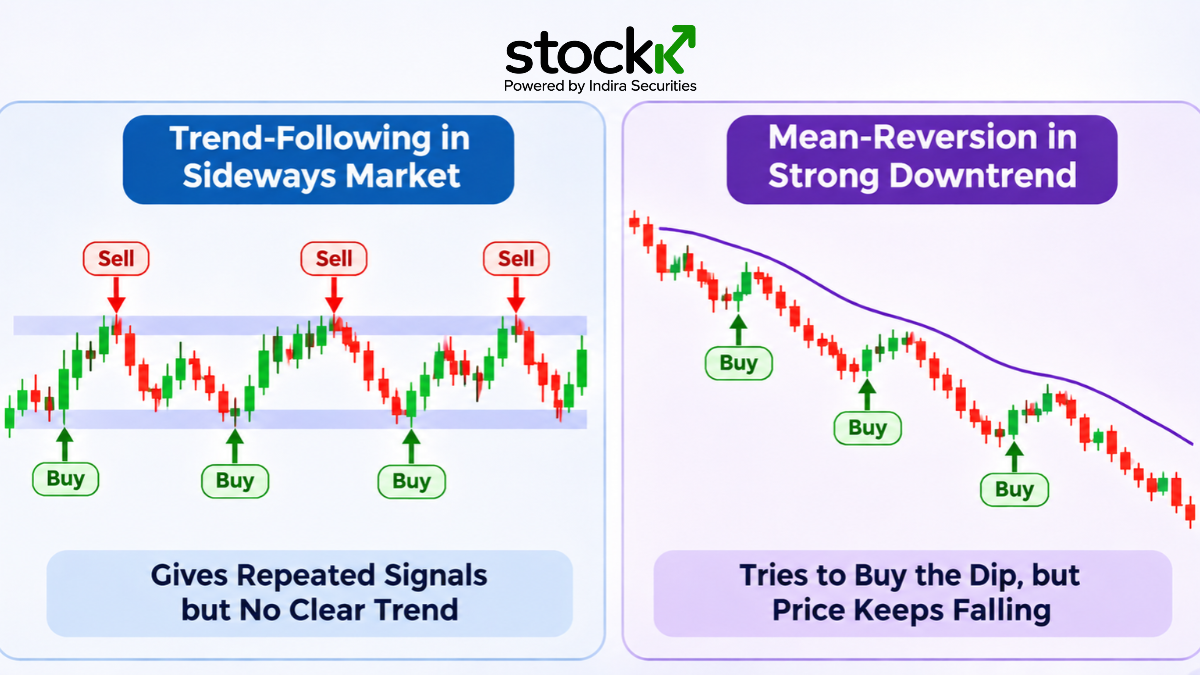
| Main Risk | Repeated false signals in sideways markets | Price continues moving away from the average |
| Focus | Trend continuation | Price returning towards its average |
Research on time series momentum has documented persistence in price movements across several futures markets and asset classes. However, this does not mean every trend continues or that the same approach works in every market.
When can each strategy struggle?
Neither approach works equally well in every market condition.
Trend following may struggle when:
Prices move sideways without a clear direction.
Breakouts fail and prices return to their earlier range.
Frequent changes in direction create repeated false signals.
Mean reversion may struggle when:
A strong trend keeps pushing prices in one direction.
A stock falls because of a major change in its business or market conditions.
Price continues moving away from its average instead of returning.
How to understand which market condition you are in
Before studying either strategy, look at the wider price chart.
Check the trend: Are prices making higher highs and higher lows, or lower highs and lower lows?
Mark support and resistance: See whether price is moving in a clear direction or staying within a range.
Study moving averages: Check whether the average is rising, falling or moving sideways.
Look at momentum: RSI and other indicators can provide additional information about price movement.
Watch for a change in conditions: A sideways market can develop into a trend, and a trend can lose direction.
Conclusion
Trend following and mean reversion are based on two different views of price movement. One looks for an existing move to continue, while the other looks for price to return towards its recent average. Neither approach is suitable for every market condition. Understanding the difference is a useful first step before studying how these strategies work on charts.
Frequently Asked Questions
Q. What is the main difference between trend following and mean reversion?
Ans. Trend following looks for an existing price move to continue. Mean reversion looks for price to move back towards its recent average.
Q. Which indicators are used in trend following?
Ans. Moving averages, trendlines and breakout levels are commonly used to study trend direction and possible continuation.
Q. Which indicators are used in mean reversion?
Ans. RSI, Bollinger Bands and moving averages are commonly used to identify price movements away from recent averages.
Q. Can mean reversion work during a strong downtrend?
Ans. It can produce temporary recovery signals, but prices may continue falling. A strong downtrend can make mean reversion setups difficult to interpret.
Q. Can traders use both strategies?
Ans. Yes. Both approaches can be studied, but traders need to identify the market condition and define separate rules for each strategy.
Disclaimer: Investments in the securities market are subject to market risks. Please read all related documents carefully before investing. This article is intended for informational and knowledge purposes only and should not be considered tax, financial, or investment advice. Tax laws and deductions may vary based on individual circumstances and regulatory changes. Readers are advised to consult a qualified tax advisor or financial professional before making any investment or tax planning decisions.
Indira Securities Private Limited (SEBI Reg. No.): NSE TM ID: 12866 | BSE TM ID: 663 | CDSL DPID: 17000 | SEBI Reg. No.: INZ000188930 | MCX TM ID: 56470 | NCDEX TM ID: 01277 | CDSL Reg. No.: IN-DP-90-2015 | CIN:U67120MP1996PTC085111 | RA SEBI Reg. No.: INH000023269 | IA SEBI Reg. No.: INA000021410 | SEBI Merchant Banking Reg. No.: INM000013536
Related Posts
Discover more insights and expert advice on investing and financial planning.


Value Investing vs Growth Investing: Which One Fits Your Goals?


Value Investing Strategy in India: Applying Benjamin Graham's Principles to Indian Stocks

Why Moving Average Crossovers Work in Backtests but Lag in Real Trading

Open Your Free Demat Account
Getting started doesn’t take much. No paperwork, no hidden charges. Just a few steps and you’re ready to invest or trade.
Open Your Free Demat Account Today
No paperwork | No hidden fees | Just a few taps to get started.