


Why Moving Average Crossovers Work in Backtests but Lag in Real Trading

Fundamental Analysis
A moving average crossover may look simple on a historical chart. The short-term average crosses above the long-term average, the strategy generates a buy signal, and the price moves higher. But when the same strategy is used in live trading, the entry may come late or the signal may fail.
The difference comes from how backtests are designed and how markets behave in real time. Understanding this gap helps traders see why historical results do not always match live trading experience.
Quick answer
Moving average crossovers can look better in backtests because historical data makes past signals easy to identify. In live trading, the crossover appears only after prices have already moved. Brokerage, slippage, false signals and changing market conditions can further affect results.
What is a moving average crossover?
A moving average calculates the average price over a selected number of periods. It helps smooth short-term price movements and makes the broader trend easier to study.
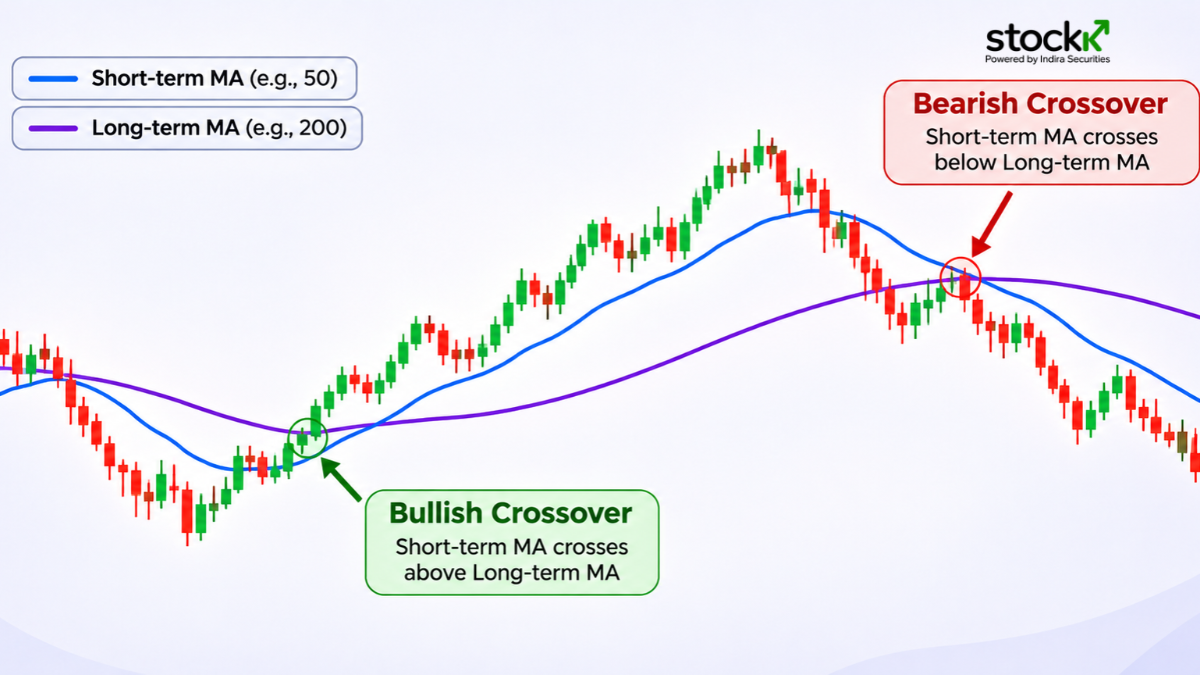
A crossover strategy uses two moving averages:
Short-term moving average: Responds faster to recent price changes.
Long-term moving average: Reacts more slowly and shows the broader price direction.
When the short-term average crosses above the long-term average, it is commonly called a bullish crossover. When it crosses below, it is called a bearish crossover.
For example, traders may study a 50-day and 200-day moving average. When the 50-day average moves above the 200-day average, the crossover is commonly called a golden cross.
Why moving average crossovers look good in backtests
Backtesting means applying a trading strategy's rules to historical price data to see how it would have performed.
A crossover strategy may show attractive historical results for a few reasons.
1. Historical trends look easier to follow: When looking at an old chart, the major price movements are already visible. It becomes easier to identify where a crossover happened and how the price moved afterwards.
In live trading, however, the next price movement is unknown. A crossover may appear during a strong trend or just before the market turns sideways.
2. Strategy settings may be over-optimised: Traders sometimes test several combinations, such as 10-day and 30-day averages, 20-day and 50-day averages, or 50-day and 200-day averages.
After testing many combinations, they may select the one that performed best on historical data. But those settings may fit past price movements rather than work consistently in different market conditions. This is known as overfitting.
3. Trading costs may be missing: Some backtests do not properly account for brokerage, taxes, exchange charges, slippage and other trading costs.
Even when a strategy shows a positive historical result, frequent trades and execution costs can reduce the actual outcome.
Why crossover signals lag in live trading
Moving averages use past prices to calculate their values. They cannot react to a price movement before it happens.
Consider a stock that rises sharply from Rs 500 to Rs 550. The short-term average begins moving up faster, but the long-term average takes more time to respond. The bullish crossover may appear only after a significant part of the rise has already happened.
This creates three common problems:
Late entry: The price may have already moved considerably before the crossover appears.
Late exit: A bearish crossover may appear after the price has started falling.
Whipsaws: In a sideways market, the averages may cross repeatedly, producing signals that quickly reverse.
What should traders check before trusting a crossover strategy?
A historical result alone is not enough to judge a strategy. Check these points:
Test different market conditions: Include trending, sideways and volatile periods.
Include all trading costs: Account for brokerage, taxes, slippage and other applicable charges.
Avoid overfitting: Do not select settings only because they produced the highest historical return.
Use out-of-sample testing: Test the strategy on historical data that was not used to develop or adjust its rules.
Try forward testing: Observe how the rules behave on new market data without committing real capital.
Common mistakes to avoid
Assuming past returns will repeat in live trading.
Ignoring slippage and trading charges.
Choosing moving average settings only from the best backtest result.
Using crossover signals without checking market conditions.
Treating every crossover as a confirmed trend reversal.
Conclusion
Moving average crossovers can help identify changes in market direction, but their signals naturally arrive after price movements begin. Backtests may also look better when costs, execution delays and changing market conditions are not properly considered. Before relying on a crossover strategy, check how it performs across different periods and include realistic trading assumptions.
Frequently Asked Questions
Q. Why do moving average crossovers give late signals?
Ans. Moving averages use past prices. The crossover appears only after enough price movement has occurred to change the relationship between the two averages.
Q. Why do moving average crossovers fail in sideways markets?
Ans. Prices keep changing direction in a sideways market. This can cause the two averages to cross repeatedly and generate false signals.
Q. Does a better backtest mean a better trading strategy?
Ans. No. A strong historical result does not guarantee similar results in live trading. Costs, execution and changing market conditions can affect performance.
Q. What is overfitting in backtesting?
Ans. Overfitting happens when strategy settings are adjusted too closely to historical data. The strategy may perform well in the test but struggle with new price data.
Q. How can traders test a moving average crossover strategy?
Ans. They can use historical backtesting, out-of-sample testing and forward testing. Trading costs and realistic execution assumptions should also be included.
Disclaimer: Investments in the securities market are subject to market risks. Please read all related documents carefully before investing. This article is intended for informational and knowledge purposes only and should not be considered tax, financial, or investment advice. Tax laws and deductions may vary based on individual circumstances and regulatory changes. Readers are advised to consult a qualified tax advisor or financial professional before making any investment or tax planning decisions.
Indira Securities Private Limited (SEBI Reg. No.): NSE TM ID: 12866 | BSE TM ID: 663 | CDSL DPID: 17000 | SEBI Reg. No.: INZ000188930 | MCX TM ID: 56470 | NCDEX TM ID: 01277 | CDSL Reg. No.: IN-DP-90-2015 | CIN:U67120MP1996PTC085111 | RA SEBI Reg. No.: INH000023269 | IA SEBI Reg. No.: INA000021410 | SEBI Merchant Banking Reg. No.: INM000013536
Related Posts
Discover more insights and expert advice on investing and financial planning.


Value Investing vs Growth Investing: Which One Fits Your Goals?


Value Investing Strategy in India: Applying Benjamin Graham's Principles to Indian Stocks

Trend-Following vs Mean-Reversion: Two Opposite Technical Strategies Explained

Open Your Free Demat Account
Getting started doesn’t take much. No paperwork, no hidden charges. Just a few steps and you’re ready to invest or trade.
Open Your Free Demat Account Today
No paperwork | No hidden fees | Just a few taps to get started.