


Support and Resistance Trading Strategy: How to Identify Levels That Actually Hold

Fundamental Analysis
Support and resistance are among the first concepts traders learn in technical analysis. But drawing a few horizontal lines on a chart does not make every level useful. You need to understand why a price zone matters and how to read the market's reaction around it.
This guide explains how to identify support and resistance zones, check their strength, and build a repeatable support and resistance trading strategy.
Quick answer
Support is a price area where buying interest may slow or stop a fall. Resistance is an area where selling pressure may slow or stop a rise. Traders identify these zones using past price reactions, swing highs and lows, trading volume and multiple timeframes. However, no level is certain to hold. Price can break through support or resistance at any time.
What are support and resistance?
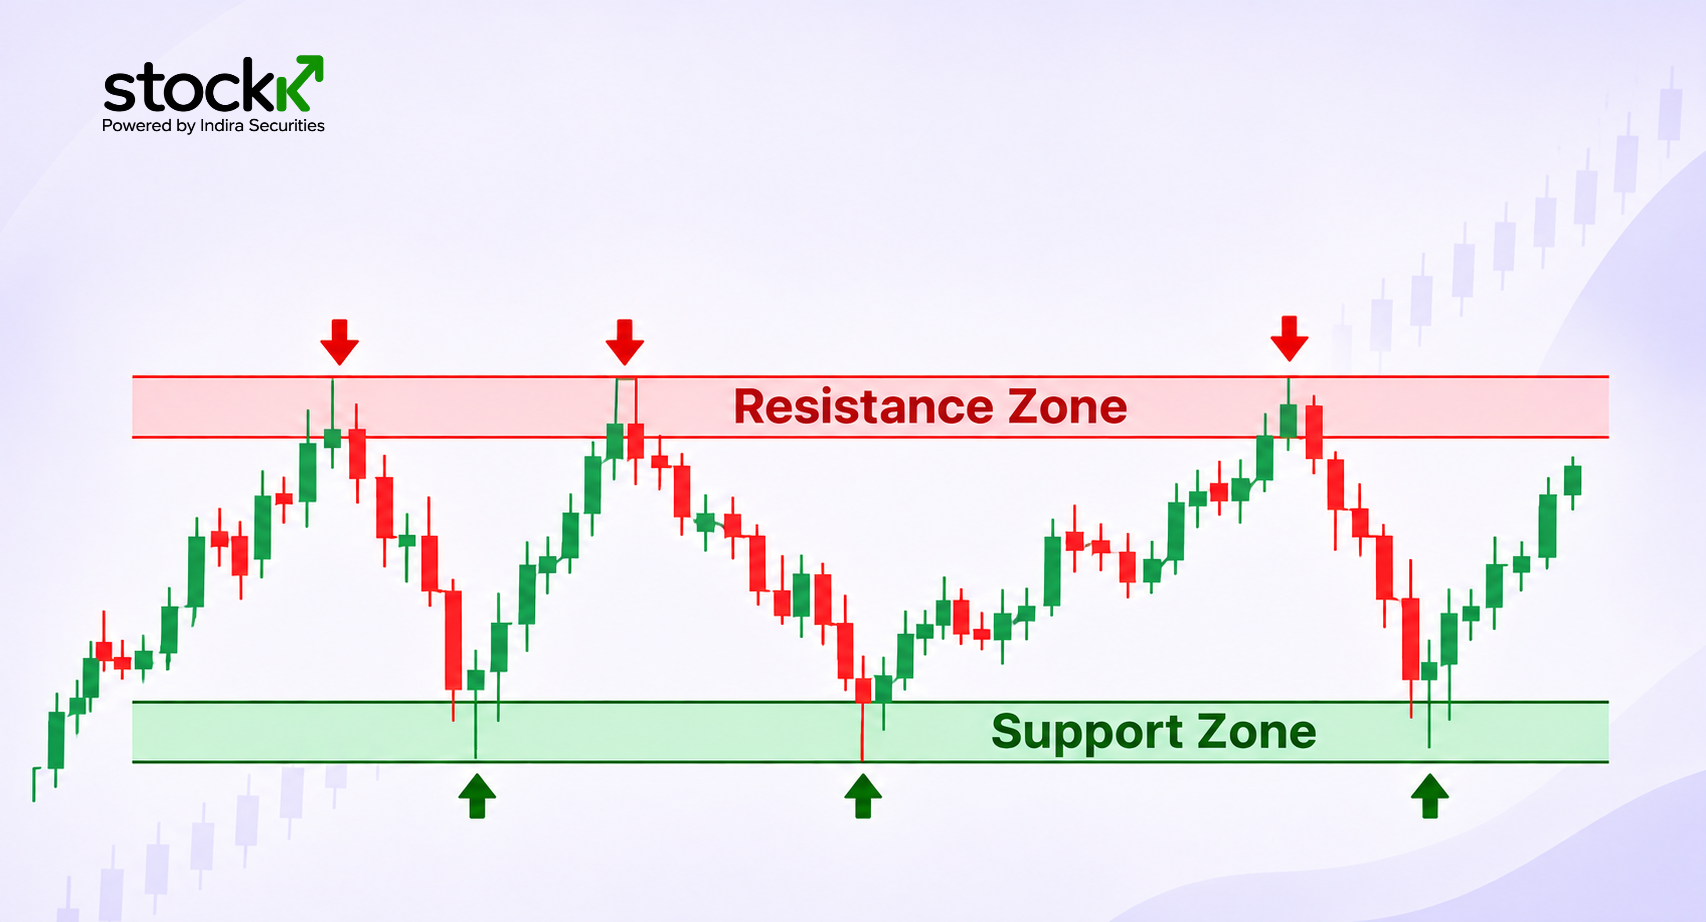
Support is a price area where a falling market has previously found buying interest. When price reaches this area, some market participants may consider it attractive.
Resistance is a price area where a rising market has previously faced selling pressure. Sellers may become more active around this zone, which can ease the rise or push the price down.
Think of support as a floor and resistance as a ceiling. But unlike a real floor or ceiling, these levels can break.
How to identify support and resistance levels
A useful support and resistance trading strategy starts with price behaviour. Indicators can support your analysis, but the first step is to read the chart.
1. Look at swing highs and swing lows
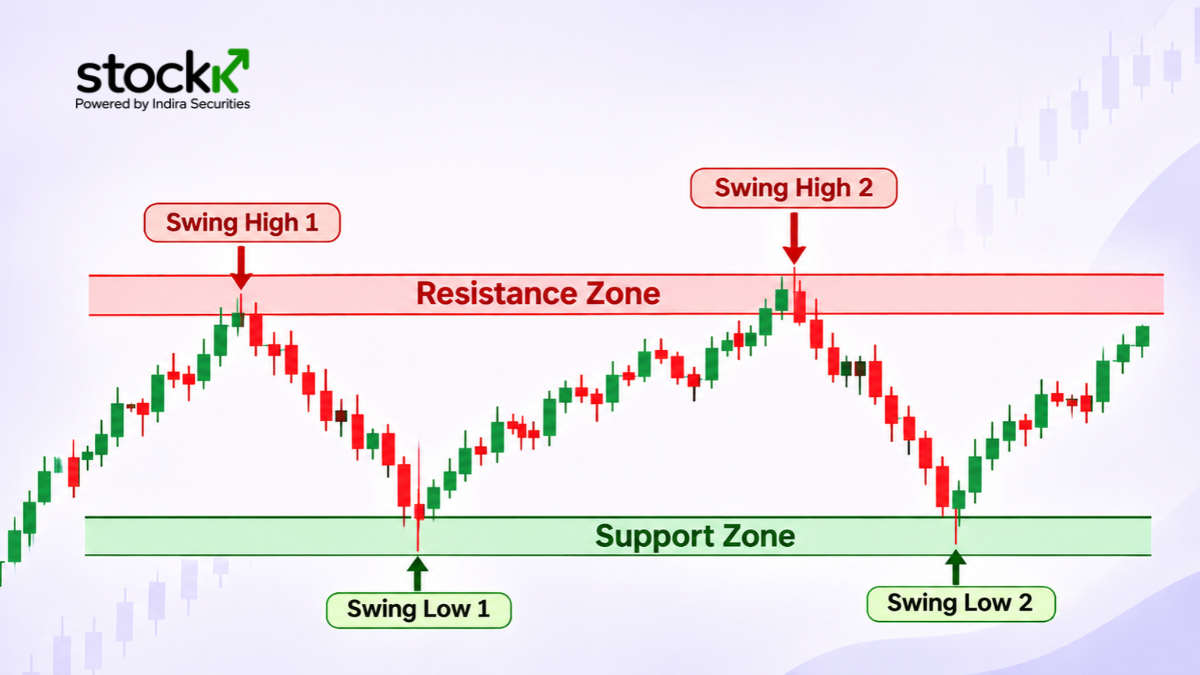
A swing high is a point where the price rises and then turns down. A swing low is where the price falls and then turns up.
Mark these points on the chart. If the price has turned down near a similar area more than once, that area may act as resistance. If it has bounced from a similar lower area, it may act as support.
Do not treat every small price movement as an important level.
2. Check more than one timeframe
A level visible on a daily chart may carry more significance than a small level on a five-minute chart. This is because the daily chart shows a wider period of price activity.
First, mark the main zones on a daily or weekly chart. Then move to a shorter timeframe to study how the price behaves near those zones.
The purpose is to avoid focusing only on small price movements while missing the wider trend.
3. Study how price reacts at the zone
The number of times a price touches a level is not the only thing that matters. The reaction also matters.
Look for signs such as:
Price moving away from the zone after reaching it.
Candles showing rejection.
A strong move away from the area.
A clear change in buying or selling activity.
4. Use trading volume as supporting information
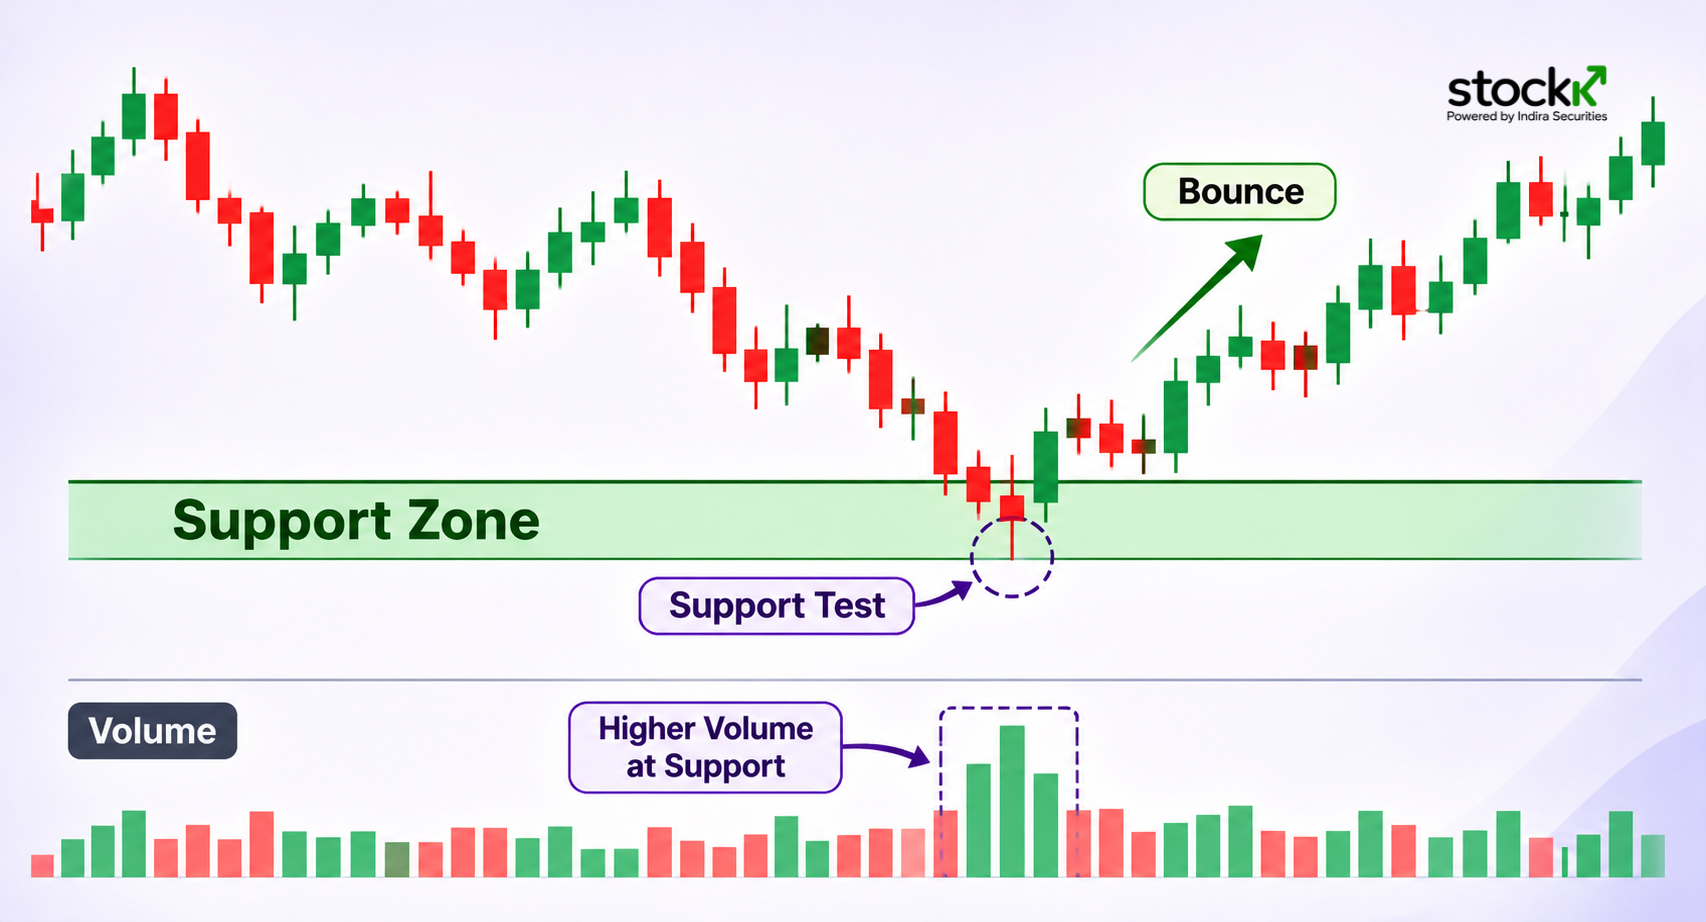
Volume shows how many shares were traded during a period. It can help you understand the activity behind a price move.
For example, a price breakout with higher-than-usual volume may show stronger participation than a move with very low volume. Still, volume alone cannot confirm that a breakout will continue.
How to build a support and resistance trading strategy
Once you have marked the zones, use a clear process to study possible trade setups. The following framework explains the steps without treating any signal as a guarantee.
| Step | What to examine |
|---|---|
| Mark the zones | Identify clear swing highs and lows. |
| Check the trend | See whether the wider market is rising, falling, or moving sideways. |
| Wait for a reaction | Observe rejection, a bounce, or a breakout near the zone. |
| Check volume | Compare activity during the price move. |
| Plan the risk | Define the point where the trade idea is no longer valid. |
For instance, take a case where the stock has been showing signs of bouncing back around Rs 500. This is likely to be flagged as a level of support. When the price reaches this level once more, one can see whether there is buying pressure or if the price falls through the support zone.
Common mistakes to avoid
A support and resistance trading strategy can become unreliable when you mark levels without a clear method.
Watch out for these:
Drawing too many lines and making the chart difficult to read.
Treating a price zone as an exact number.
Ignoring the wider market trend.
Assuming every breakout will continue.
Placing a stop-loss without considering normal price movement and volatility.
Changing the marked levels simply because the market moves against an earlier view.
Doesn’t work usually during big events/news
Conclusion
Support and resistance help traders study where buying and selling pressure has appeared in the past. Their value depends on the quality of the price reaction, the wider trend and the market's behaviour around each zone. A clear support and resistance trading strategy uses these levels as areas to observe, not as guaranteed turning points.
Frequently asked questions
Q. What is the difference between support and resistance?
Ans. Support refers to a zone at which buying can help stall a downtrend. On the other hand, resistance refers to a zone in which selling can help stall an uptrend.
Q. How to identify strong support and resistance levels?
Ans. The key is to identify swing highs/lows, see how prices react and find zones on higher timeframes. The volume and candle actions may give you more insights.
Q. Can support become resistance?
Ans. Yes. When price breaks below a support zone, that area may act as resistance if the price later rises back towards it. This is known as role reversal.
Q. Can I use support and resistance in intraday trading?
Ans. Yes. Traders can use intraday charts to identify these levels, while checking higher timeframes for important price zones.
Q. Is support and resistance trading suitable for beginners?
Ans. Yes. Support and resistance are core concepts in technical analysis. Beginners should learn how to identify these levels because they help in understanding price movements, possible reversals and breakouts.
Disclaimer: Investments in the securities market are subject to market risks. Please read all related documents carefully before investing. This article is intended for informational and knowledge purposes only and should not be considered tax, financial, or investment advice. Tax laws and deductions may vary based on individual circumstances and regulatory changes. Readers are advised to consult a qualified tax advisor or financial professional before making any investment or tax planning decisions.
Indira Securities Private Limited (SEBI Reg. No.): NSE TM ID: 12866 | BSE TM ID: 663 | CDSL DPID: 17000 | SEBI Reg. No.: INZ000188930 | MCX TM ID: 56470 | NCDEX TM ID: 01277 | CDSL Reg. No.: IN-DP-90-2015 | CIN:U67120MP1996PTC085111 | RA SEBI Reg. No.: INH000023269 | IA SEBI Reg. No.: INA000021410 | SEBI Merchant Banking Reg. No.: INM000013536
Related Posts
Discover more insights and expert advice on investing and financial planning.


Value Investing vs Growth Investing: Which One Fits Your Goals?


Value Investing Strategy in India: Applying Benjamin Graham's Principles to Indian Stocks

Trend-Following vs Mean-Reversion: Two Opposite Technical Strategies Explained

Open Your Free Demat Account
Getting started doesn’t take much. No paperwork, no hidden charges. Just a few steps and you’re ready to invest or trade.
Open Your Free Demat Account Today
No paperwork | No hidden fees | Just a few taps to get started.