


Why the Same Chart Pattern Gives Different Results in Trending vs Sideways Markets

Technical Analysis
A flag, triangle or double top may look similar on two stock charts, but the price may behave differently after the pattern forms. One setup may lead to a strong move, while another may fail and send the price in the opposite direction.
The reason is usually the market condition. A chart pattern in a strong trend can behave differently from one formed during a sideways market.
Quick answer
The same chart pattern can give different results in trending and sideways markets. In a trending market, it may support the existing price direction. In a sideways market, the price may fail to continue after the breakout. This is why checking the market condition is important before interpreting a chart pattern.
Why market conditions matter when reading chart patterns
Chart patterns show how prices have moved, but their shape alone cannot explain what may happen next.
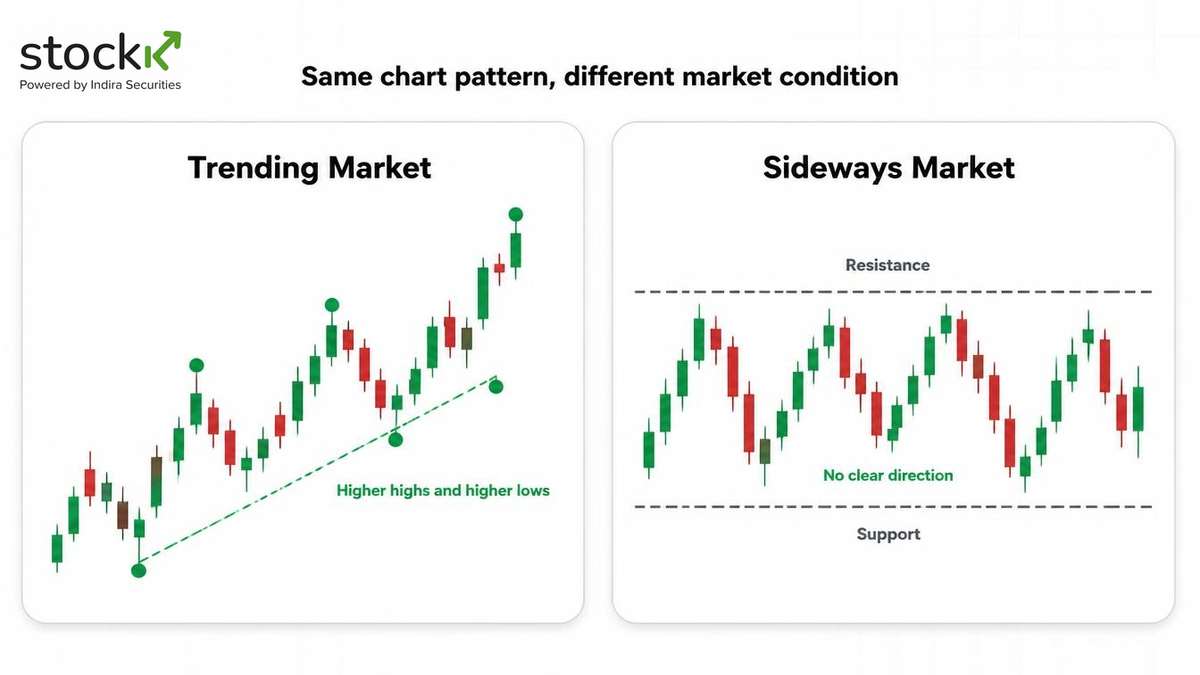
A trending market has a clear direction. In an uptrend, prices generally make higher highs and higher lows. In a downtrend, they make lower highs and lower lows.
In a sideways market, prices move between support and resistance without making consistent progress in either direction.
This difference matters because the same formation can represent a temporary pause in a trend or simply another movement inside a range.
How chart patterns behave in trending markets
In a trending market, traders often look for continuation patterns that suggest the existing direction may continue.
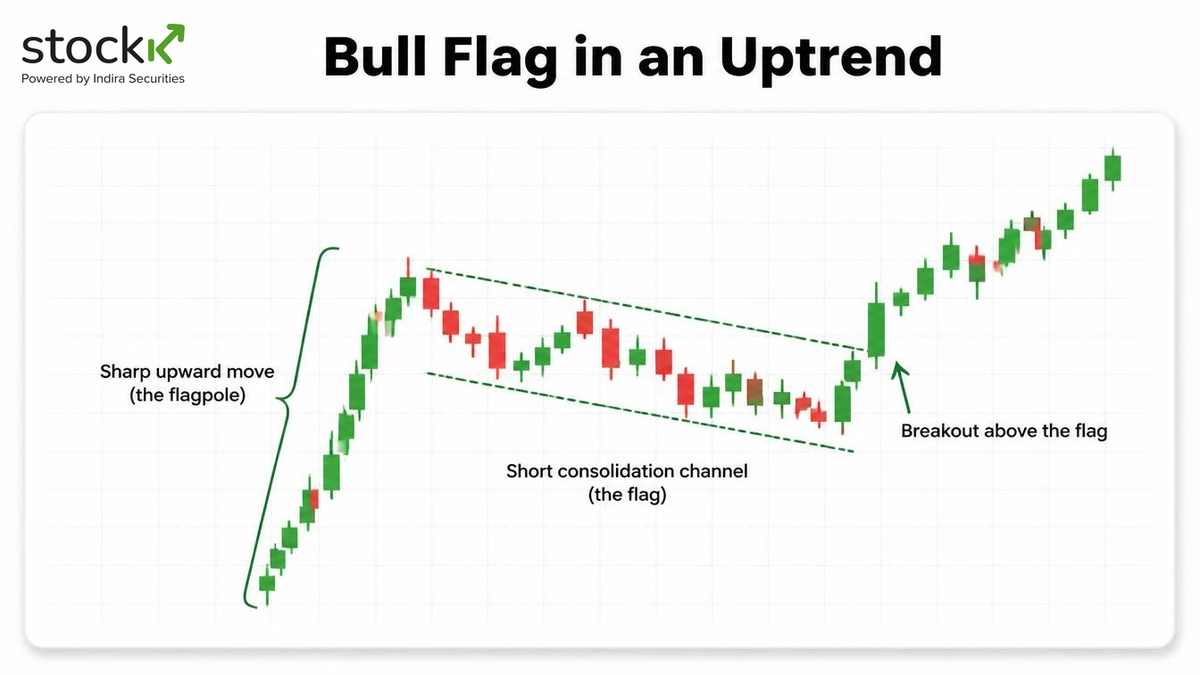
For example, a bull flag forms when a stock rises sharply, pauses and moves within a small downward-sloping range. A breakout above the flag may signal further movement in the earlier direction.
Pennants and some triangles can also appear during trend pauses.
However, not every pattern is a continuation signal. A double top after a long rise may indicate weakening buying pressure. Traders should wait for price confirmation before interpreting it as a reversal.
What to check:
Is there a clear trend before the pattern forms?
Does the price maintain its higher highs and higher lows, or lower highs and lower lows?
Does the breakout happen in the direction of the existing trend?
Does trading volume support the price move?
How the same patterns behave in sideways markets
In a sideways market, prices move between support and resistance without either buyers or sellers taking clear control.
A triangle or rectangle may simply show consolidation rather than continuation of an existing trend.
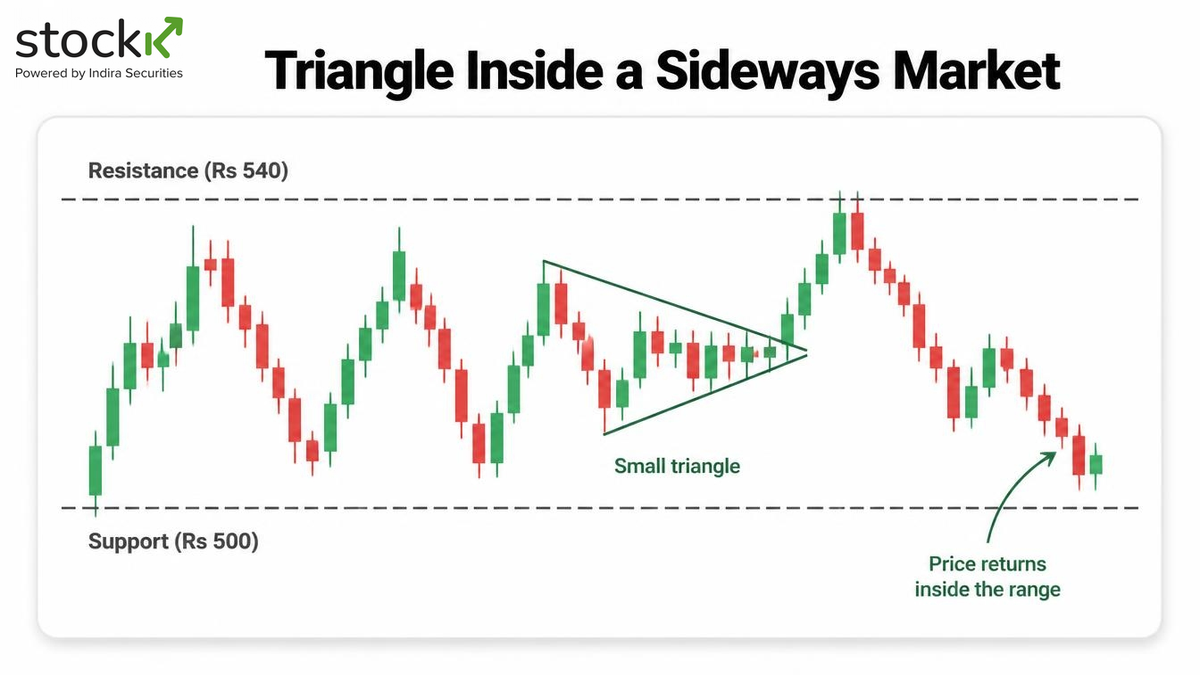
For example, imagine a stock trading between Rs 500 and Rs 540 for several weeks. It forms a small triangle near the middle of this range.
An expected upward breakout may fail, sending the price back towards support.
The placement of the pattern is important. A pattern near resistance could attract selling, while a pattern near support could attract buying.
Neither reaction is guaranteed.
What to check:
Is the price still moving between established support and resistance?
Is the pattern forming near the top, bottom or middle of the range?
Has the price actually closed outside the range?
Is there enough follow-through after the breakout?
Trending vs sideways markets: What changes?
The same formation can have a different interpretation.
| Chart pattern | In a trending market | In a sideways market |
|---|---|---|
| Bull flag | May signal an uptrend continuation | May be a short pause within the range |
| Triangle | May continue the previous trend after a breakout | Can break in either direction |
| Double top | May warn of a possible trend reversal | May show another rejection near range resistance |
| Rectangle Pattern | May represent consolidation before trend continuation | Often reflects movement between support and resistance |
These are common interpretations, not fixed outcomes.
How to read a chart pattern before interpreting it
Before focusing on the pattern, follow a simple process:
Identify the market condition: Check whether the chart is trending upward, trending downward or moving sideways.
Mark support and resistance: Note the important price zones around the pattern.
Study the previous price movement: A continuation pattern needs an existing trend to continue.
Wait for confirmation: See if the price moves outside the pattern boundary and if the move sustains.
Check volume: Compare the volumes during the formation and breakout phases. The volume provides information, but it is not always an indicator of a successful breakout.
Common mistakes traders should avoid
Identifying a pattern without checking the wider market trend.
Assuming every triangle or flag pattern will break in a particular direction.
Treating an intraday move beyond a pattern boundary as a confirmed breakout.
Ignoring nearby support and resistance.
Depending only on volume or indicators to confirm a setup.
Conclusion
A chart pattern's form is never enough to tell the whole story. It is important to know its placement in relation to past price action and the current state of the market. The appearance of a flag pattern during a strong uptrend can indicate the need for rest before rising again, whereas the same pattern appearing in a ranging market will be unproductive.
Frequently Asked Questions
Q1. Why do chart patterns not work in sideways markets?
Ans. Sideways markets lack any definite trend. Price action can break a chart pattern and revert back to the same trading range.
Q2. Do chart patterns work better in trending markets?
Ans. Some continuation patterns are easier to interpret when a clear trend exists. However, no pattern guarantees that the price will continue in the same direction.
Q3. Can a triangle pattern break in either direction?
Ans. Yes. Price can move above or below a triangle. The direction becomes clearer only after the price moves beyond its boundary.
Q4. How can traders identify a sideways market?
Ans. Look at the chart. If the price keeps moving between similar upper and lower levels for some time, the market may be sideways.
Q5. Should traders check the trend before using chart patterns?
Ans. Yes. The same pattern will act differently when the trend is bullish, bearish, or sideways. Determining the trend helps to understand the pattern better.
Disclaimer: Investments in the securities market are subject to market risks. Please read all related documents carefully before investing. This article is intended for informational and knowledge purposes only and should not be considered tax, financial, or investment advice. Tax laws and deductions may vary based on individual circumstances and regulatory changes. Readers are advised to consult a qualified tax advisor or financial professional before making any investment or tax planning decisions.
Indira Securities Private Limited (SEBI Reg. No.): NSE TM ID: 12866 | BSE TM ID: 663 | CDSL DPID: 17000 | SEBI Reg. No.: INZ000188930 | MCX TM ID: 56470 | NCDEX TM ID: 01277 | CDSL Reg. No.: IN-DP-90-2015 | CIN:U67120MP1996PTC085111 | RA SEBI Reg. No.: INH000023269 | IA SEBI Reg. No.: INA000021410 | SEBI Merchant Banking Reg. No.: INM000013536
Related Posts
Discover more insights and expert advice on investing and financial planning.


Technical Analysis Strategy for Beginners: Building a Repeatable Trading Framework


Why a fundamentally strong company can be a technically bad trade right now

Nifty at a 6-month low: 5 data signals that tell you if the bottom is in

Open Your Free Demat Account
Getting started doesn’t take much. No paperwork, no hidden charges. Just a few steps and you’re ready to invest or trade.
Open Your Free Demat Account Today
No paperwork | No hidden fees | Just a few taps to get started.